Debugging
Annotation Processor
With Gradle
Debugging the annotation processor stage is a bit tricky as you are essentially debugging the Java Compiler (javac).
Gradle, however, allows you to attach a debugger during the compilation stage by setting the property org.gradle.debug to true.
To start Gradle with that flag, figure out a target that invokes the annotation processor and start it like this:
In this case we are compiling the litho-widget package.
This will pause the execution during the "Starting Daemon" phase until you connect your debugger. This can be done by running a standard "Remote" target in IntelliJ which will look like this:
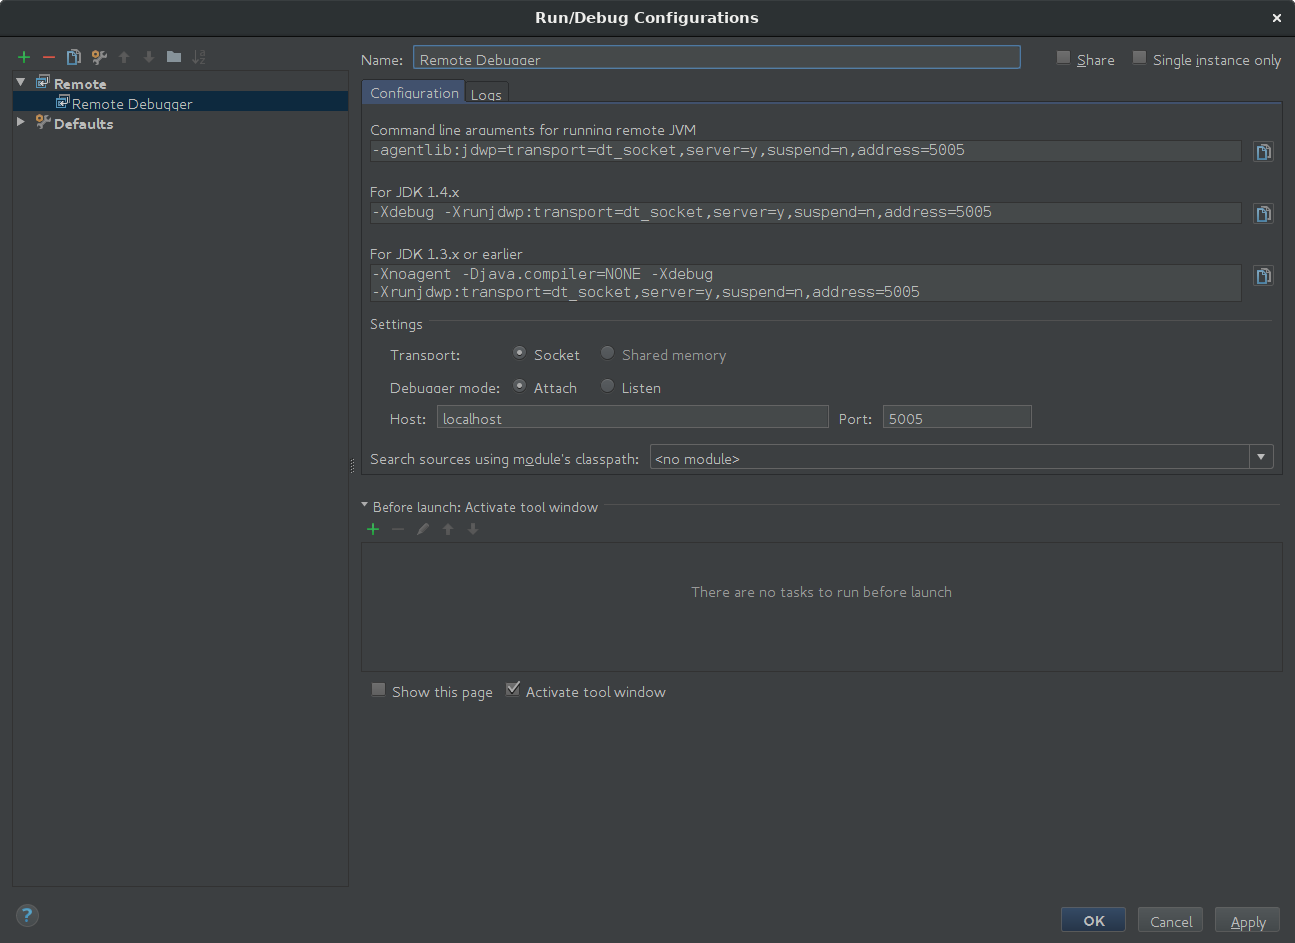
Now set a breakpoint at the right point, run your remote target and debug away!
With Buck
Buck doesn't have built-in support for suspending the compiler, but you can still attach a debugger by directly instrumenting the JVM to open a debugging port.
For that, first make sure to kill any previous instances of Buck which may still be running with old flags, then
set the JAVA_TOOLS_OPTIONS to contain the JDWP options. Exporting the variable
make sure that this is also picked up by child processes spawned by buck.
Limiting the number of threads will dramatically speed up the interactive
debugging performance as you won't have to wait for the scheduler to come around
again and hand you a time slice.
Note that this won't pause the JVM (suspend=n), but as the process will continue to run you can choose to
attach to the process at any time.